 GeoData.NZ
University of Otago
Type of resources
Topics
Keywords
Contact for the resource
Provided by
Years
Update frequencies
status
-
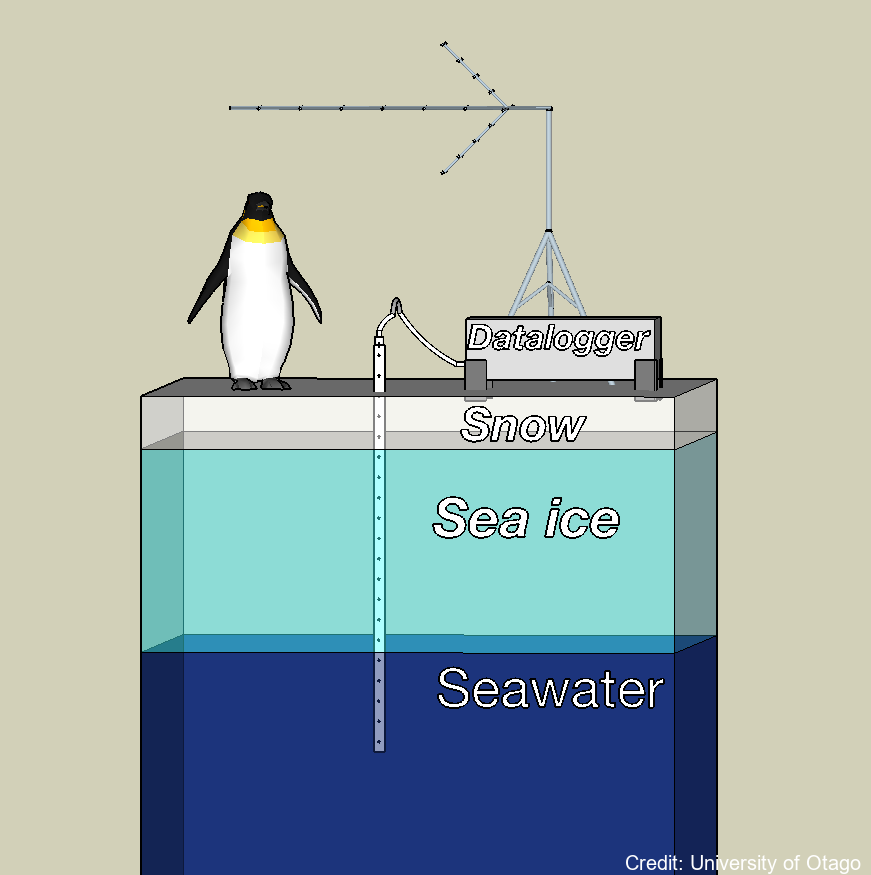
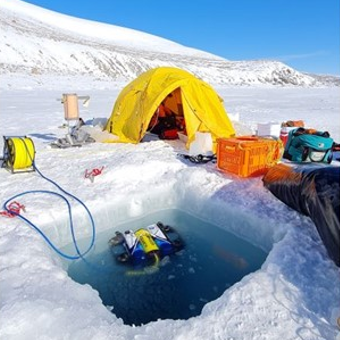
A semi-autonomous sea ice monitoring station (SIMS) was deployed to record ice temperature profiles and snow depths throughout the winter to late spring portion of the sea ice cover's growth season. These data were used to quantify the factors that govern the rate at which the sea ice grows. These factors include the local air temperature, vertical temperature gradient in the sea ice, the thickness of the overlying snow cover and the properties of the water column at the ice / water interface. The ice temperature profiles were recorded by a custom-built temperature probe designed by the University of Otago. The Otago thermistor probe consisted of twenty thermistors contained within a ~ 2.5 m long, 10 mm diameter stainless steel tube. The spacing of the thermistors in the probe was variable. This dataset provides information on the growth of the landfast sea ice and how much of this growth was due to heat loss to the atmosphere vs heat loss to the ocean. Locations: lat:-75.275700, lon:164.067300 (2022/23) Sea ice salinity and fabric cores were collected to understand sea ice growth rates, and indicate the different types of landfast sea ice (e.g. columnar versus incorporated platelet) and to determine their relative vertical positions with the sea ice cover. Sea ice, sub ice platelet layer, snow and freeboard measurements were used to validate ice thicknesses determined by analysing the sea ice temperature profiles collected by the SIMS. Snow depths were measured with a Campbell Scientific ultrasonic sensor (SR50). VIEW DATA: https://seaice.otago.ac.nz/ice-temp-graph/contour/
-
This metadata record represents environmental DNA sequence data and metadata barcode file. Seawater and sponge eDNA metabarcoding sampling was conducted at seven coastal locations (Cape Barne, Cape Evans, Cziko Seamount, Granite Harbor Middle, Granite Harbor South, and Turtle Rock) in the Ross Sea to assess spatial eukaryote biodiversity patterns and investigate eDNA signal differences between both substrates. Five replicate 500 mL water samples were collected at each of seven locations within 2 m of the ocean floor using a Niskin bottle. At the same time, five sponge specimens were collected by ROV at a depth range of 18–30 m from three out of the seven locations, thereby enabling sponge and near-bottom water eDNA signal comparison. Further details and laboratory procedures can be found in https://doi.org/10.1002/edn3.500 GET DATA: https://figshare.com/projects/Unveiling_the_Hidden_Diversity_of_Marine_Eukaryotes_in_the_Ross_Sea_A_Comparative_Analysis_of_Seawater_and_Sponge_eDNA_Surveys/186127